
How Are Turn-Key brewery solutions Designed for Different Production Capacities?
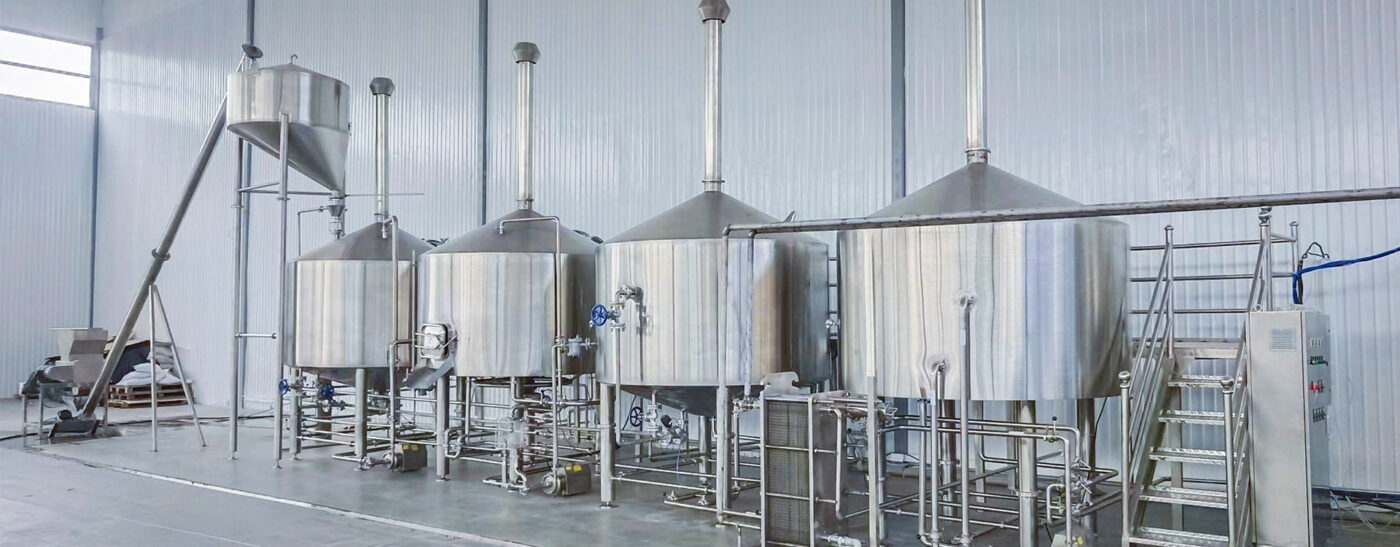
A turn-key brewery is sized from production flow, not tank volume alone. A 1,000 L system brewing twice per day produces about 2,000 L of wort, while four cycles raise daily output to roughly 4,000 L before process losses. Cellar sizing then depends on fermentation time: 14 days at 4,000 L/day represents about 56,000 L of occupied fermentation volume. Water, steam, glycol cooling, CIP, and packaging must follow the same production schedule. Brewers Association benchmarking separates breweries into four annual production groups, from below 1,000 bbl to above 100,000 bbl, because resource use changes substantially with scale. Capacity planning therefore starts with batches per day, tank occupancy, peak utility demand, and packaging hours—not a single brewhouse volume.
A 500 L brewpub and a 5,000 L production brewery may use similar brewing stages, but their equipment arrangement is rarely similar. At 500 L, one or two batches per day can often be handled by a two-vessel setup combining mash/lauter and kettle/whirlpool functions. At 5,000 L and four batches, the plant has to move about 20,000 L through the hot side in one production day. Separating mash, lautering, boiling, and whirlpool operations allows the next batch to start before the previous batch has completed every stage. That scheduling difference leads directly to the first major sizing choice: how many vessels the hot side needs.
A two-vessel Brewhouse is generally easier to fit into a small facility because fewer vessels, pumps, valves, platforms, and process connections are required. A three- or four-vessel configuration becomes more useful when the target is several batches per day, because vessel occupancy rather than nominal liters starts limiting output. A modern industrial example shows how far this approach can scale: a Belgian brewery modernization completed in 2024 was designed for up to 12 brews per day at 150 hl of cold wort per brew, equal to as much as 1,800 hl across 12 brews.
Vessel count should be checked against cycle time. A 3,000 L system completing one batch every six hours and another completing one every three hours have the same nominal batch capacity but can differ by 100% in daily hot-side output.
Once the brewing schedule is known, fermentation volume can be estimated from wort production and tank occupancy. A 2,000 L system producing three batches per day supplies about 6,000 L to the cellar. With an average 14-day occupancy, roughly 84,000 L is tied up before allowing time for emptying, CIP, filling, or longer-conditioned products. Fifteen 6,000 L tanks provide 90,000 L of gross space, but a brewery making lagers for 28 days may need close to twice the occupied capacity of one producing beer on a 14-day schedule.
Fermenter size changes scheduling as well as total liters. A 1,000 L brewhouse paired only with 1,000 L fermenters offers recipe flexibility, while 2,000 L fermenters can receive two consecutive batches and reduce the number of vessels, valves, temperature-control branches, and CIP connections. The trade-off is product mix: filling a 2,000 L vessel with one recipe commits twice as much volume to that beer. For a brewery selling ten rotating beers, more small tanks may be practical; for three high-volume products, larger tanks usually make production scheduling simpler. That cellar schedule then determines refrigeration demand.
| Production case | Daily brewing example | 14-day theoretical cellar occupancy | Practical design issue |
|---|---|---|---|
| 500 L × 2 brews | 1,000 L/day | 14,000 L | Small tanks and simple routing |
| 1,000 L × 3 brews | 3,000 L/day | 42,000 L | Double-batch tank filling |
| 2,000 L × 4 brews | 8,000 L/day | 112,000 L | More CIP and glycol capacity |
| 5,000 L × 4 brews | 20,000 L/day | 280,000 L | Fixed piping and higher automation |
Those figures are planning examples rather than universal specifications because fermentation heat is not released evenly over 14 days. Glycol equipment has to handle periods when several recently filled fermenters are actively fermenting while other tanks remain at cold-conditioning temperature. Chiller selection therefore uses peak thermal demand, ambient conditions, coolant temperatures, tank insulation, wort cooling arrangements, and simultaneous users rather than dividing monthly energy use by operating hours. By 2024, brewery process suppliers were also applying heat-pump systems to recover and reuse thermal energy across heating and cooling duties.
Heat demand follows a similar pattern. Wort heating and boiling can consume a large share of brewhouse thermal energy, so a brewery performing six batches has different steam timing from one performing a single batch. Published GEA data reports brewhouse thermal consumption across installed systems ranging roughly from 18 to 40 kWh/hl, with energy-storage arrangements reporting primary-energy reductions of 20–50% at brewhouse level. The same source describes recovering kettle-vapor energy to heat wort from about 77°C to 94–95°C before final heating.
Real operating data also shows why nominal equipment size cannot describe energy performance. At Germany's Apoldaer Vereinsbrauerei, which brewed 500 batches in 2023, process changes increased reported energy recovery from 50% to 85.3%, reduced evaporation from 5% to 3.8%, and cut thermal energy use per batch by 38%, corresponding to more than 88,000 kWh annually. External laboratory samples were analyzed before and after the modification to check product parameters.
Heat recovery becomes more useful as batch frequency rises because recovered heat from one brew can be available for a following brew. Production sequence therefore affects both vessel utilization and utility sizing.
Water planning follows the same production sequence. Brewing water is only part of total demand; tank rinsing, CIP, floor cleaning, packaging, utilities, and heat exchange can consume substantial volumes. Brewers Association material cites a U.S. brewery average near seven barrels of water per barrel of beer, while some craft breweries operate below three to one. The same material reports that roughly 70% of incoming brewery water can leave as wastewater, although actual ratios depend strongly on plant design and operating practice.
For a brewery producing 10,000 L of beer, a 7:1 water-to-beer ratio corresponds to approximately 70,000 L of incoming water, whereas 3:1 corresponds to about 30,000 L. That 40,000 L difference affects incoming-water treatment, hot-water storage, drains, wastewater handling, and utility cost. A 2024 modernization at Roman Brewery later reported 2.0 L less water per liter of beer in the hot block, alongside about 60% lower energy use for wort heating and boiling and 30% lower boiler gas consumption.
Cleaning capacity has to rise with tank count rather than just brewhouse liters. Six fermenters cleaned every two weeks create a very different CIP timetable from 30 fermenters turning over on similar cycles. A small brewery can operate a mobile CIP cart with manual hose connections, while a larger cellar may use centralized caustic, acid, recovery-water, and final-rinse tanks with fixed supply and return piping. Brewers Association guidance notes that water use and wastewater remain major operating concerns even after improvement over the past 20 years, which makes rinse duration, chemical recovery, and water reuse part of equipment specification rather than an afterthought.
CIP pumps also cannot be selected from vessel volume alone. Cleaning fluid must reach the spray device at the pressure and flow required by that device while overcoming elevation and pipe losses. A 1,000 L fermenter positioned several meters from a portable CIP skid has different hydraulic conditions from a 10,000 L tank connected through a long fixed return line. Older MBAA technical work on process-vessel rinsing also examined continuous versus short-burst rinsing because rinsing can consume large quantities of water and the operating method changes total consumption.
As tank numbers rise, fixed sanitary piping becomes easier to justify. A small plant may transfer beer through food-grade hoses over short distances, while a 20,000 L/day facility can benefit from dedicated product, CIP, glycol, water, compressed-air, and CO₂ distribution. Pipe diameter has to support the required transfer rate without excessive pressure loss or impractical cleaning conditions. Cutting a 40-minute transfer to 20 minutes represents a 50% reduction in transfer time, which becomes significant when several transfers and cleaning cycles occur in the same shift.
Automation follows operating frequency rather than a simple liters threshold. A 500 L brewery making three batches per week may work well with manual butterfly valves and basic temperature controllers. A 5,000 L plant making six batches per day can require automated valves, variable-frequency pump control, flow measurement, level sensing, recipe steps, temperature loops, and CIP sequencing because repeated manual routing consumes more labor and creates more opportunities for inconsistent timing. In the 2023 Apolda case, added measurement and process control accompanied the reported 38% reduction in energy use per batch.
Packaging then sets another capacity limit. A brewery producing 12,000 L of finished beer per day but packaging only 2,000 L per hour needs six theoretical filling hours before allowing for CIP, product changes, label or container changes, stoppages, and startup losses. If effective line availability falls to 80%, those six theoretical hours become 7.5 scheduled hours. A 1,000 L/hour line under the same conditions requires about 15 hours, so adding fermentation capacity would not solve the packaging restriction.
Bright beer tanks can provide separation between cellar and packaging schedules. If a canning line handles 4,000 L/hour and operates for five effective hours, it can process about 20,000 L. A 20,000 L bright-beer buffer can therefore support roughly one such packaging run, while two 10,000 L tanks allow one product to package while another is prepared. The better arrangement depends on SKU count, keg versus can volume, filtration or centrifugation steps, and how frequently products change. Those requirements also affect building layout.
A 10,000 L tank contains roughly 10 metric tonnes of water-based product before vessel weight, fittings, platforms, and connected piping are considered. Larger tanks also increase ceiling-clearance requirements and concentrate loads over a smaller floor area. Drainage has to handle cleaning discharge at the rate it arrives rather than annual averages. Brewers Association material reports brewery wastewater BOD values around 600–5,000 ppm and COD around 1,800–5,500 ppm, with combined effluent pH potentially moving from about 3 to 12 depending partly on acidic and alkaline cleaning streams.
Expansion planning is therefore easiest before tanks are installed. A 2,000 L brewery expecting production to rise 50% does not necessarily need 50% larger equipment everywhere. Space for four additional fermenters, spare glycol-header connections, electrical capacity, additional valve positions, and sufficient drainage may allow the existing hot side to support higher annual output simply by increasing batches per week. Brewers Association benchmarking already separates production into below 1,000, 1,000–10,000, 10,000–100,000, and above 100,000 bbl/year groups, reflecting how operating conditions differ across scale.
A turn-key specification can therefore be checked as one connected production schedule: annual liters establish weekly output; weekly output sets brew frequency; brew frequency sets vessel occupancy; occupancy determines fermentation capacity; tank turnover sets CIP frequency; simultaneous fermentation and cold storage establish refrigeration demand; hot-side timing establishes steam and hot-water demand; finished-beer release sets packaging hours. When any one section is sized 20–30% below the throughput expected from the others, waiting time can move from one department to another even though every individual machine operates within its stated capacity.
Start your discreet consult
Board-licensed physicians. NABP-accredited pharmacies. Plain-box shipping. From $1.20 a dose.
Start Online Consult — From $1.20/dose